INTRADAY TECHNICAL ANALYSIS MAY 16th (observation as of 08:52 UTC)
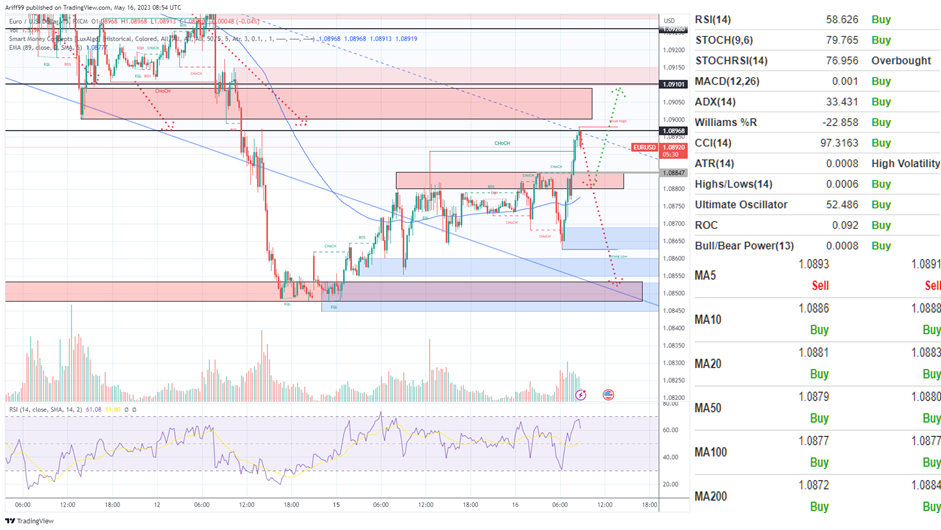
[EURUSD]
Important Levels to Watch for:
- Resistance line of 1.08968
- Support line of 1. 08847
Commentary/ Reason:
1. The price was on a downtrend in the parallel channel and recently experienced high volatile movement to the downside that break below channel boundaries before re-entering, signifying the price readiness to push lower.
2. The Euro is losing strength after US dollar strengthened but eventually recovered as debt ceiling remains a crisis and US stock market rejuvenated on weaker dollar.
3. Eurozone industrial production came in lower but have been offset by worsening US manufacturing data. Retail sales data is incoming today that will turn the markets head.
4. The price is expected to trade below but have some room to recover to either resistance level at 1.08968 and push lower or break above to high supply area at resistance 1.09101.
5. Technical indicator is showing that the price is already overbought and there is a reversal candle forming which means retracement is imminent before continuing uptrend.

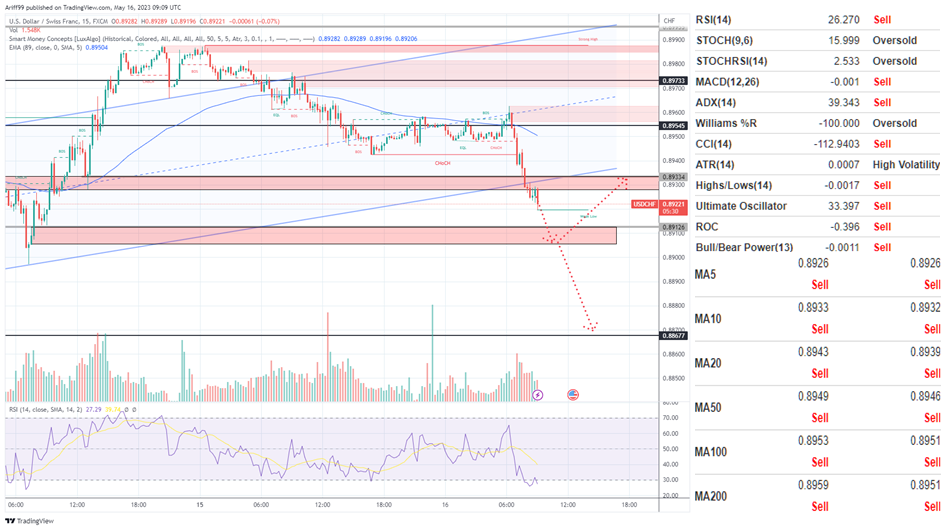
[USDCHF]
Important Levels to Watch for:
- Resistance line of 0.89334
- Support line of 0.89126
Commentary/ Reason:
1. The pair have been in sideways before continuing on its trend downward and now looking for a strong support level.
2. The price is now on strong downside movement as swiss strong currency aren’t affected while the US is suffering.
3. The monthly retail sales data is expected to be stronger than expected on unwavering consumer spending.
4. The price is expected to move further downward to support level at 0.89126 or even lower.
5. Technical indicators is blaring with selling signals but it is now at oversold area which can result in rebound.

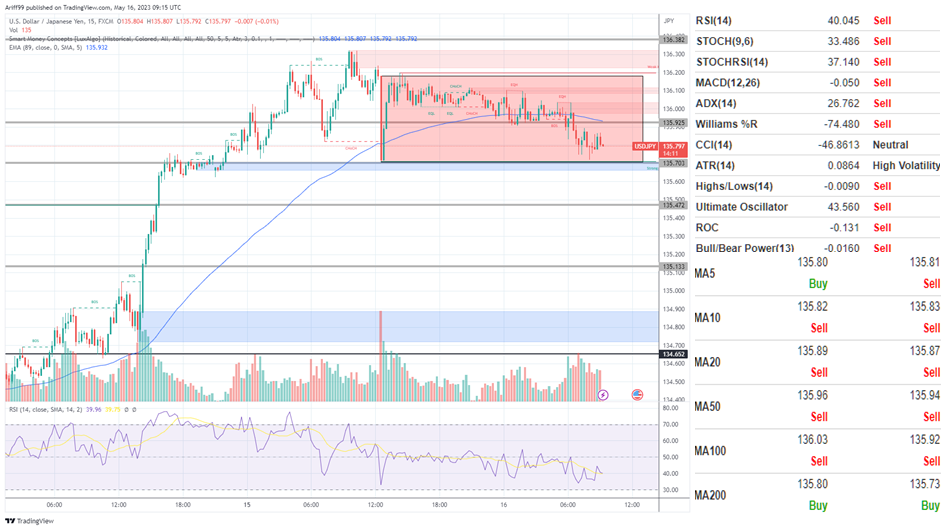
[USDJPY]
Important Levels to Watch for:
- Resistance line of 135.925
- Support line of 134.703
Commentary/ Reason:
1. The pair were previously on a steep uptrend but after a sharp downtrend candle, the market has been on a sideway for a while.
2. The price was affected by industrial production data from china and is struggling to recover.
3. There is significant economic data from Japan which is their Q1 GDP data and Retail Sales from the US.
4. The price is expected to continue in sideways until it break in either side before going into the direction it breaks into if there is no retesting the boundaries that it breaks.
5. Technical indicators are all saying sell but warn that the volatility might be higher than normal.

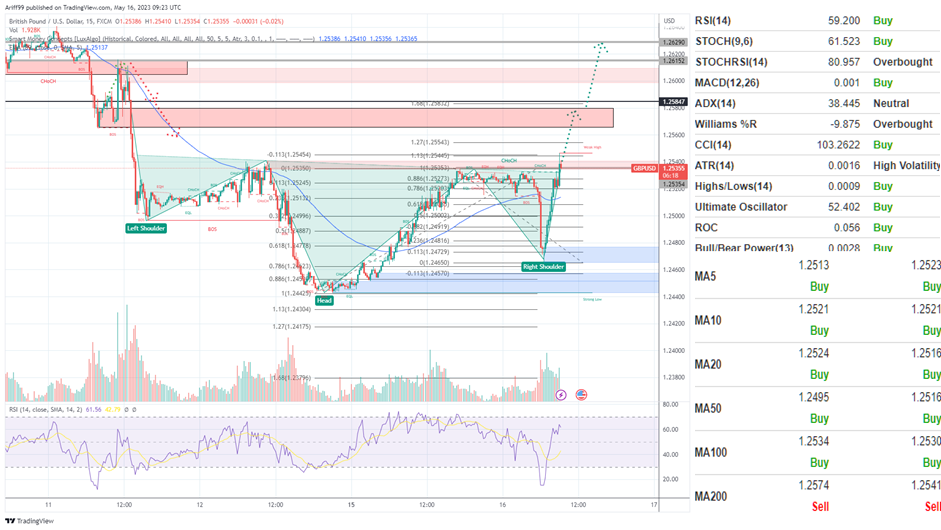
[GBPUSD]
Important Levels to Watch for:
- Resistance line of 1.25847
- Support line of 1.25354
Commentary/ Reason:
1. The pair have been on a strong downtrend but recently recovered some of its lost value.
2. The price fell after USD strengthened although its weakened right after investor is anticipating stronger consumer data that will lead to more hawkish feds.
3. There was employment and wages data from the UK that show higher unemployment claims which sent the price of GBP higher on dovish ECB and can expect them to stop increasing rates.
4. The price is expected to keep hiking higher to Fibonacci target zone at 1.25847 or lower in the supply range but the head and shoulder that formed may force the price to be higher at 1.26290.
5. Technical indicator is blaring with buying signals but more sensitive indicators is cautioning investor that it is overbought and have higher volatility than normal.


